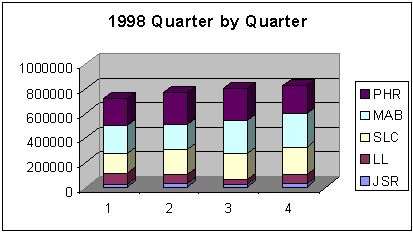


The process is quite straightforward.
Design a MIRC report that contains the data you want to graph. We suggest that you keep your report fairly simple in content. For example, show subtotals only by Responsible Attorney or Working Attorney or Client Attorney or Case Type or Client Type. You should probably have only one alpha field on the report and a few numeric columns, perhaps each with a different date range.
Tell Legalmaster to print the report to a file in data format. You do this by selecting the file option toward the upper left of the print dialogue box, checking data, as opposed to text toward the lower left and specifying a path and file name in the upper right. As a result, instead of the report actually printing on paper at your printer, its contents are stored in a CSV (comma delimited) file.
Run the MIRC report.
The data are now in the file that you indicated in step #2 above. You must now use your spreadsheet software, Microsoft's Excel or Lotus, for example, to create your graph from that file. In your spreadsheet program, open the file in which you stored your Legalmaster data. You may have to tell the spreadsheet that the file is comma delimited. Your data should now appear on your spreadsheet as if you had typed them in yourself.
We assume that you know how to create graphs from the data.